How to setup our GSC dashboard
Instructions incoming.
Our free GSC report is a bit more complex to set-up than a normal report (i.e. because we have a bunch of cool features), you can’t just simply make a copy.
But don’t worry we’re going to walk you through how to do it.
Are you a video person?
If so we've got a video version of this post you can watch here.
1. Head over to our resource library to get access to all our templates
You can find that over here.
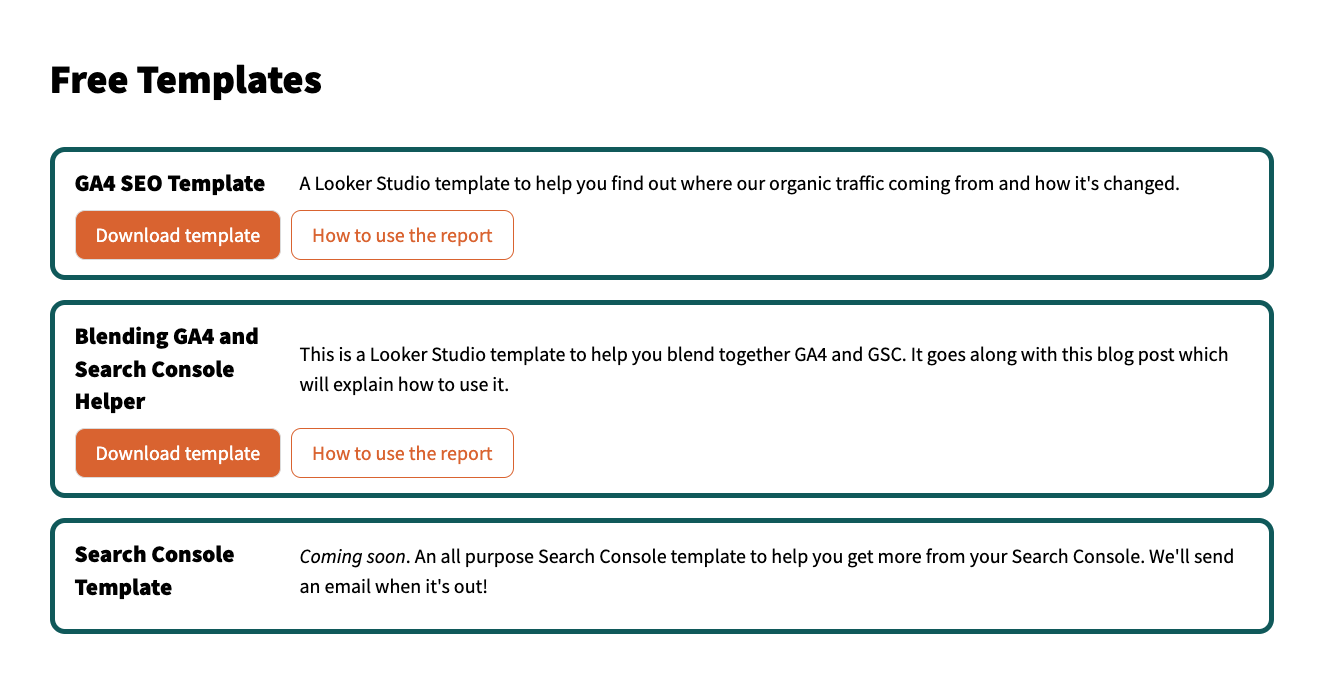
Open it up and then come back here.
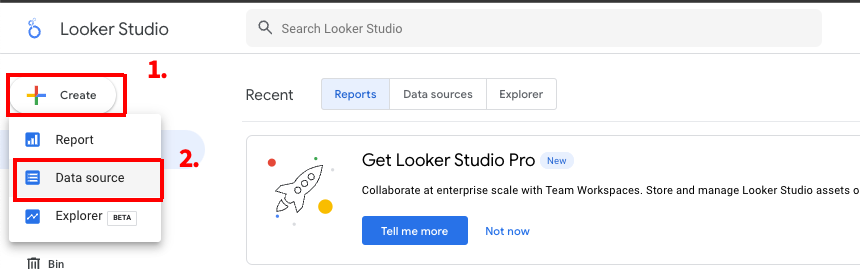
2. Create a data source to Looker Studio
You might notice if you tried to jumping straight to copying the report that you won’t be able to see your default search console connectors.
Instead you'll need to add a data source and set it up first. Here's how you do that.
Open up Looker Studio > [Create] > [Data Source]
Then you’re going to:
- Name it
- Select your site
- Select URL impression
- Select web
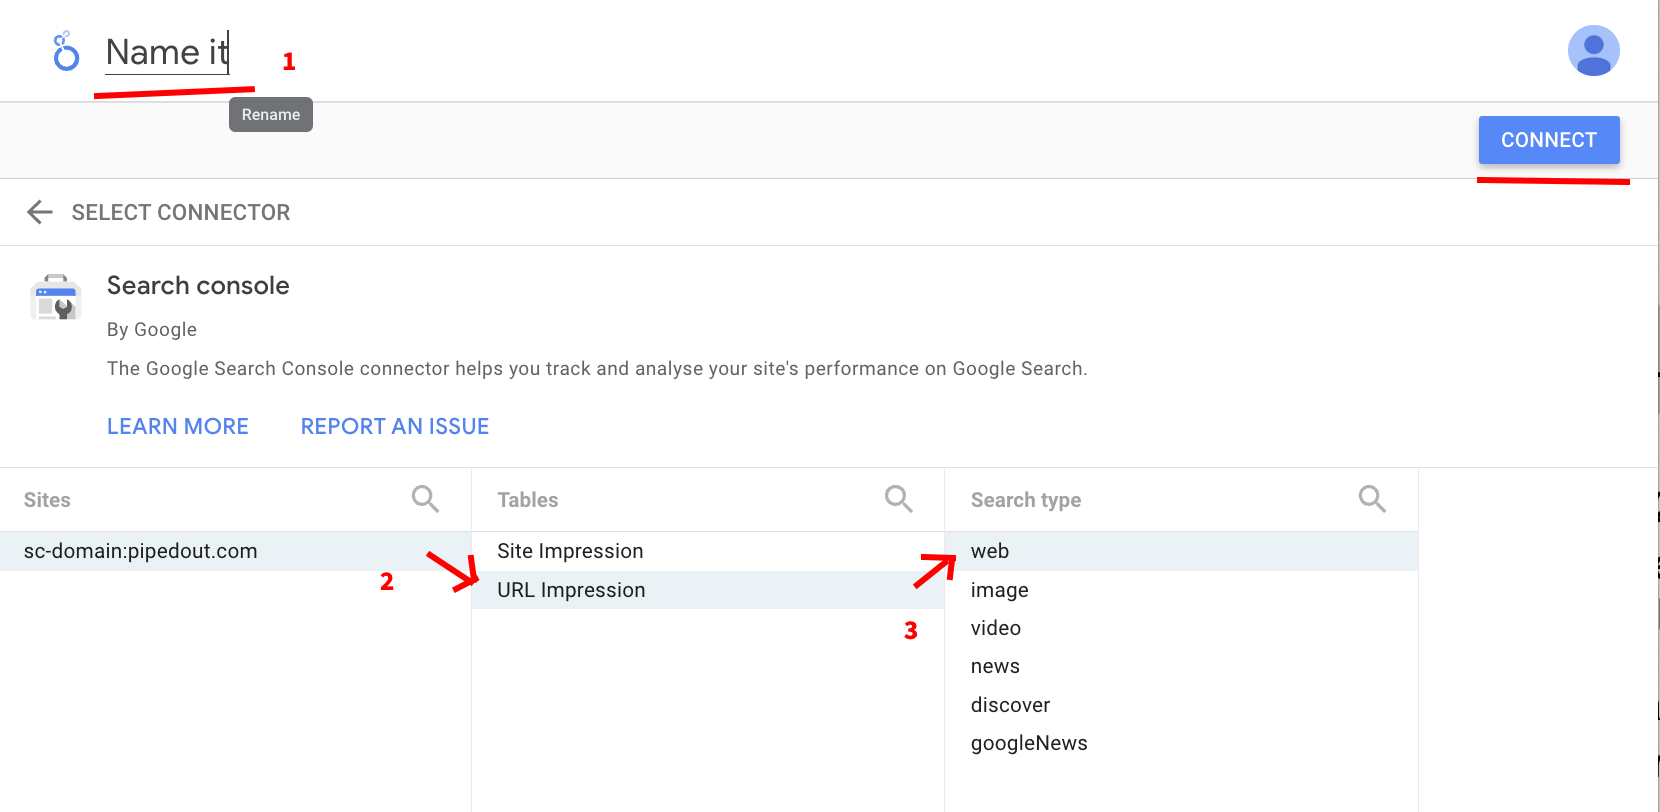
Now we're ready to setup the data source it.
3. Editing the data source
There are two big things we need to do:
- Create custom fields
- Add custom parameters
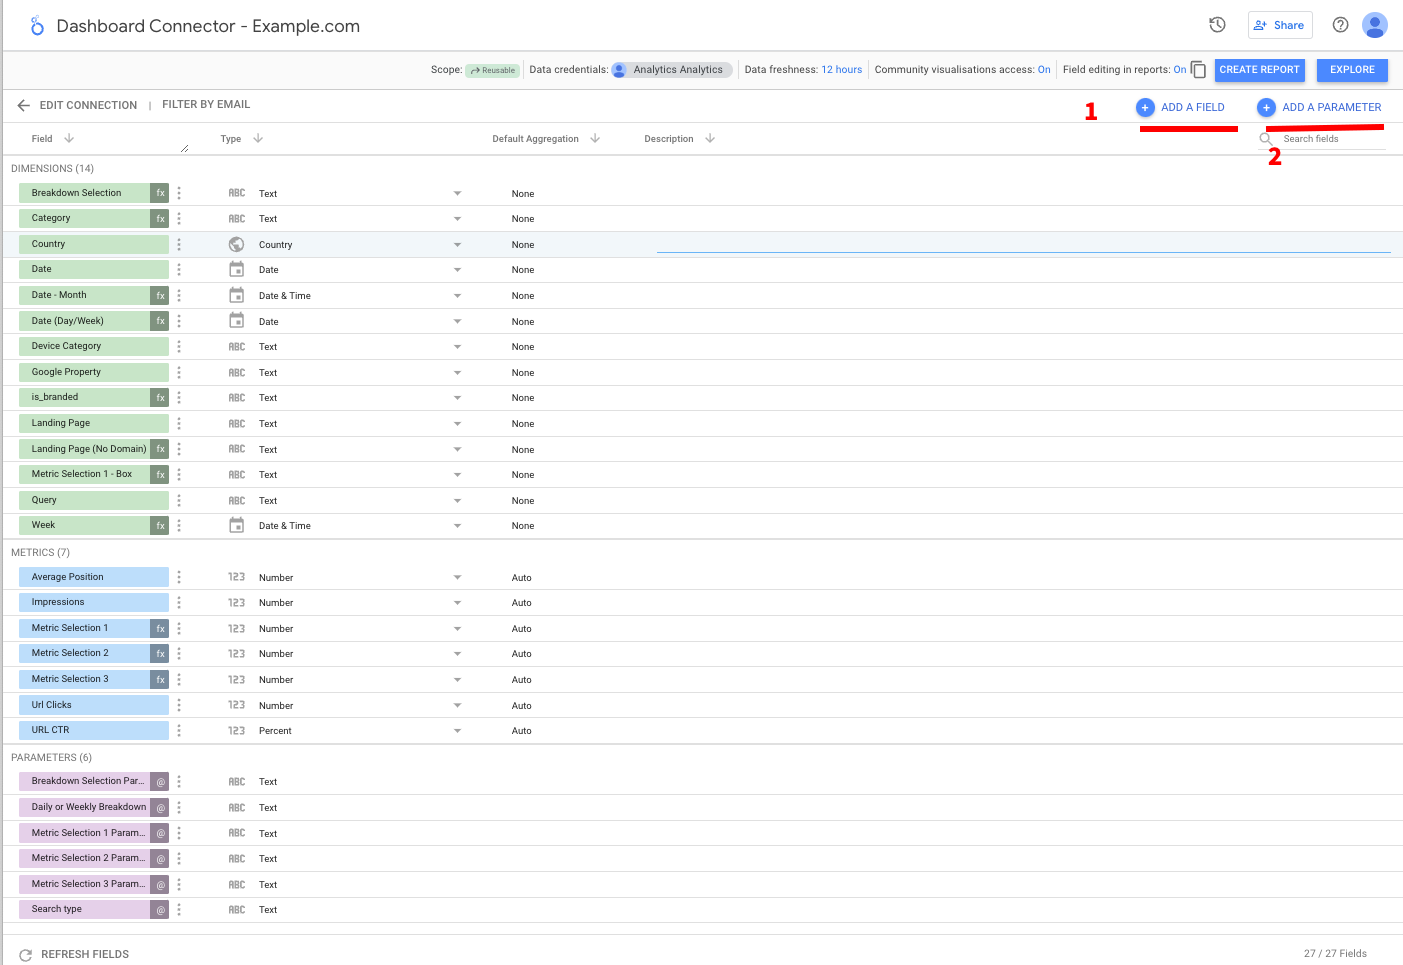
There’s quite a few of these so we’re going to walk through them one by one.
3a. Parameters we need to add
You’ll first need to go through and make all these parameters. The form looks like this:
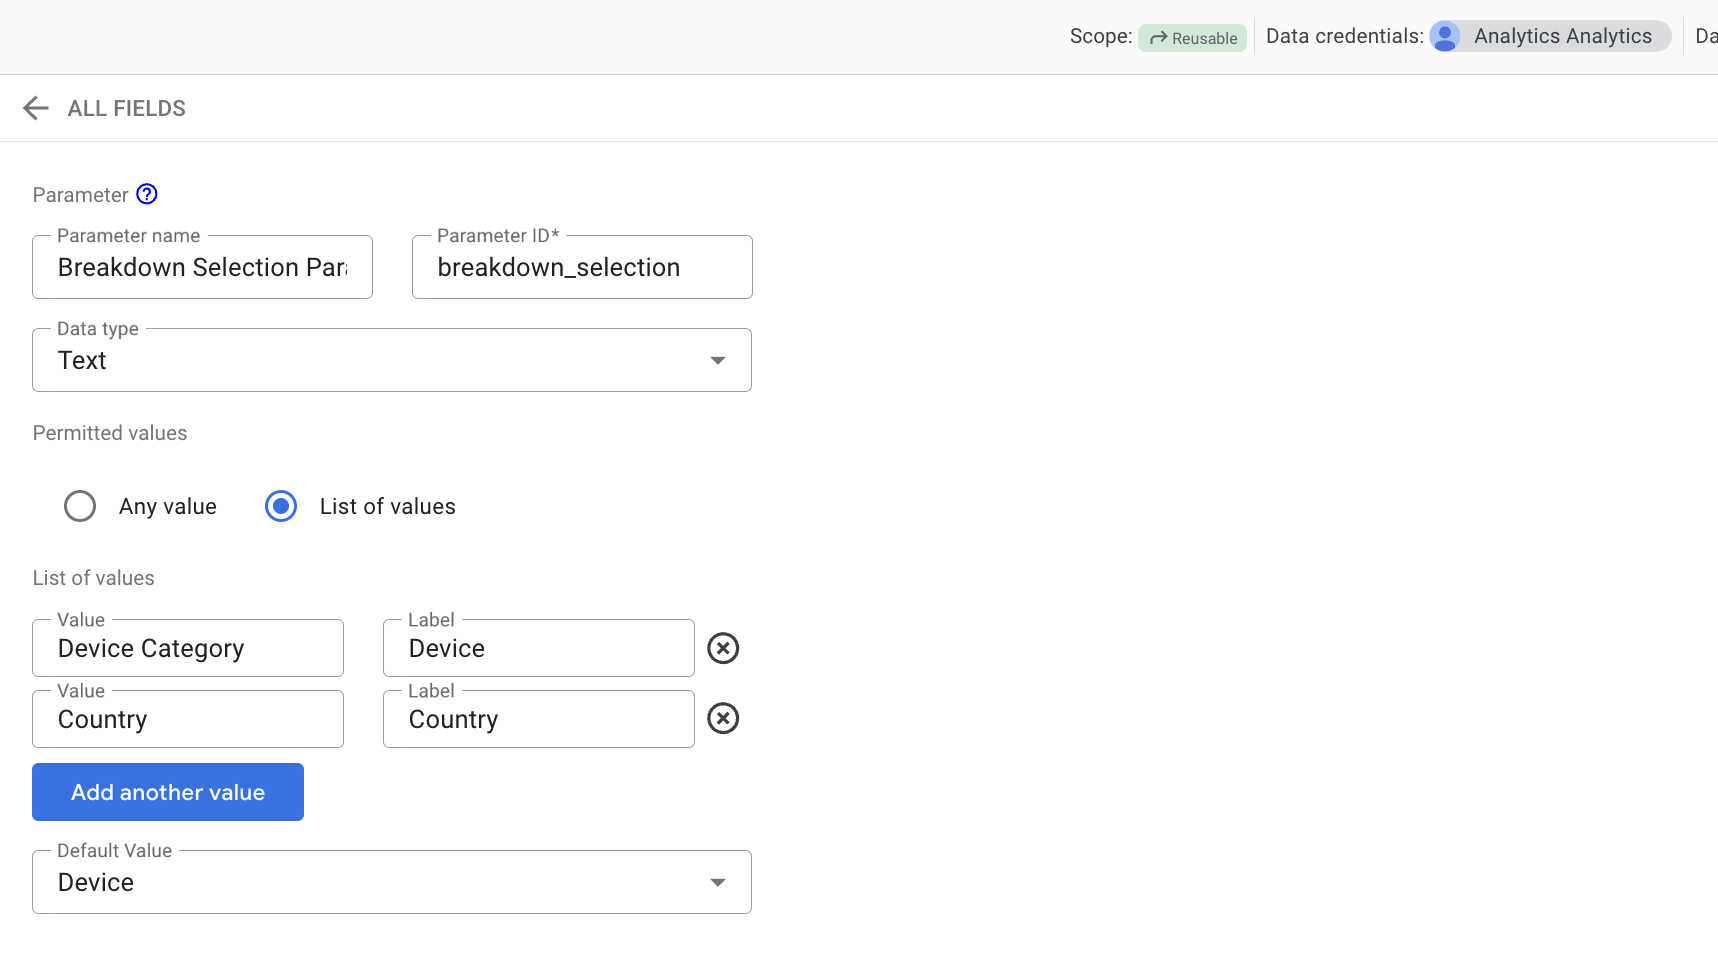
Here are all the ones we need to make.
Breakdown Selection Parameter
- Name: Breakdown Selection Parameter
- ID: breakdown_selection
- Data Type: Text
- Permitted values:
- List of values (value, label):
- Device Category, Device Category
- Country, Country
- List of values (value, label):
Breakdown Selection 2 Parameter
- Name: Breakdown Selection 2
- ID: breakdown_selection_id_2
- Data Type: Text
- Permitted values:
- List of values (value, label):
- page, Page
- query, Query
- List of values (value, label):
Daily or Weekly Breakdown
- Name: Daily or Weekly Breakdown
- ID: daily_or_weekly_breakdown
- Data Type: Text
- Permitted values:
- List of values (value, label):
- daily, Daily
- weekly, Weekly
- List of values (value, label):
Metric Selection 1 Parameter
- Name: Metric Selection 1 Parameter
- ID: metric_selection_1
- Data Type: Text
- Permitted values:
- List of values (value, label):
- Clicks, Clicks
- Impressions, Impressions
- CTR, CTR
- Avg. Rank, Avg. Rank
- List of values (value, label):
Metric Selection 2 Parameter
- Name: Metric Selection 2 Parameter
- ID: metric_selection_2_parameter
- Data Type: Text
- Permitted values:
- List of values (value, label):
- Clicks, Clicks
- Impressions, Impressions
- CTR, CTR
- Avg. Rank, Avg. Rank
- List of values (value, label):
Metric Selection 3 Parameter
- Name: Metric Selection 3 Parameter
- ID: metric_selection_3_parameter
- Data Type: Text
- Permitted values:
- List of values (value, label):
- Clicks, Clicks
- Impressions, Impressions
- CTR, CTR
- Avg. Rank, Avg. Rank
- List of values (value, label):
3b. Fields we need to add
Once we've added all the parameters now we need to add new fields.
We need to set all 3 following pieces for a field:
- Field Name
- Field ID
- Formula
You need to remember to also set Field ID otherwise Looker Studio will get confused and mix up fields when copying the report.
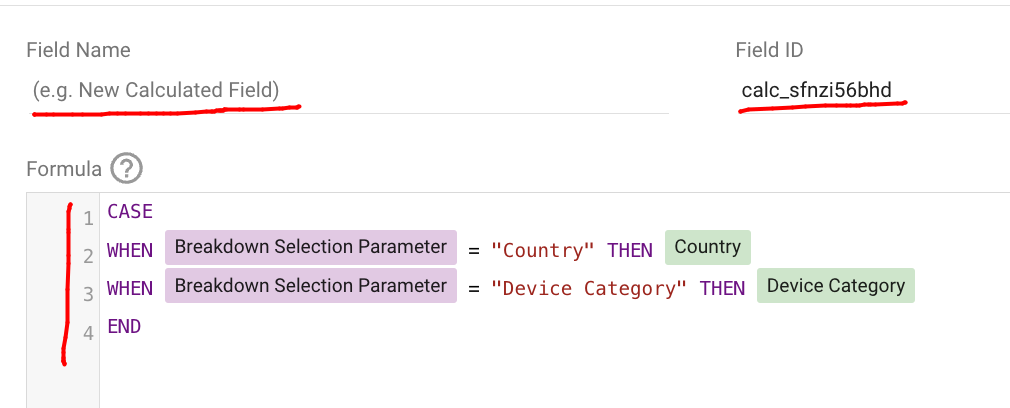
Field: Breakdown selection
-
What does it do: Used in report selection.
-
Field name: Breakdown Selection
-
Field ID: calc_ipmiq0zpgd
-
Formula:
CASE
	WHEN Breakdown Selection Parameter = "Country" THEN Country
	WHEN Breakdown Selection Parameter = "Device Category" THEN Device Category
END
Field: Breakdown selection
-
What does it do: Used in report selection.
-
Field name: Breakdown Selection 2
-
Field ID: calc_bzh70t6mhd
-
Formula:
case
    when REGEXP_CONTAINS(Breakdown Selection 2, "[Qq]uery") then Query - (Use)
    when  REGEXP_CONTAINS(Breakdown Selection 2, "[Pp]age") then Landing Page (No Domain) - (Use)
end
Field: Category
-
What does it do? A breakdown of your site into sections.
-
Field Name: Category
-
Field ID: calc_1e15yjtmgd
-
Formula:
CASE WHEN REGEXP_CONTAINS(Landing Page, '/products/') THEN 'Product Page' WHEN REGEXP_CONTAINS(Landing Page, '/categories/') THEN 'Category Page' WHEN REGEXP_CONTAINS(Landing Page, '/content/') THEN 'Content Page' ELSE 'Other Page' END -
This one you’re going to want to personalise to your own site sections. The format is:
CASE
WHEN REGEXP_CONTAINS(Landing Page, 'match URL pattern') THEN 'Template'
ELSE 'Other Page'
END

# If regex is giving you issues then you can use contains format:

CASE
WHEN Landing Page LIKE '%{url pattern goes here}%' THEN 'Template'
ELSE 'Other Page'
END
Date (Day/Week)
-
What does it do? Lets you switch between days and weeks.
-
Field Name: Date (Day/Week)
-
Field ID: calc_zisau5h6gd
-
Formula:
if(Daily or Weekly Breakdown= "daily", Date, date(Week))
Date (Month)
-
What does it do? We use with targets that exist at a monthly level.
-
Field Name: Date (Month)
-
Field ID: calc_mg554qhhhd
-
Formula:
DATETIME_TRUNC(Date, MONTH)
Intent Categorisation
-
What does it do? A very basic intent categorisation. You probbly want to customise this for your region.
-
Field Name: Intent Categorisation
-
Field ID: calc_cc5wty4chd
-
Formula:
case
    when (regexp_contains(Query, r"(?i)\b(what|who|why|where|how|guide|template|idea|example|learn|tutorial|question|definition|meaning|how to|diy)\b"))
    then "Informational"
    when (regexp_contains(Query, r"(?i)\b(best|top|review|color|comparison)\b"))
    then "Commercial"
    when (regexp_contains(Query, r"(?i)(price|buy|coupon|cheap|discount|free|purchase|order|deal|sale|offer|promo|shop)"))
    then "Transactional"
    else "Other"
end
is_branded
-
What does it do? Let’s you filter to branded traffic.
-
Field Name: is_branded
-
Field ID: calc_3slug9l6gd
-
Formula:
case
	when REGEXP_CONTAINS(Query, "piped ?out") then "branded"
    else "non-branded"
end
Landing Page (No Domain) - (Use)
-
What does it do?: In order to anonimise our dashboard, we do some regex replaces. You're going to want to change the formula to what we have below and replace the domain.
-
Field Name: Landing Page (No Domain) - (Use)
-
Field ID: calc_xfobjd3dhd
-
Formula:
REPLACE(Landing Page,"https://www.pipedout.com","")
Metric Selection 1 - Box
-
What does it do?: We use to show you which metrics are selected
-
Field Name: Metric Selection 1 - Box
-
Field ID: calc_b6b120wpgd
-
Formula:
Metric Selection 1 Parameter
Query (Use)
-
What does it do?: In order to anonimise our dashboard, we do some regex replaces. In this case we just want to set it to this. The if 'hack' is necessary to make the report copy nicely.
-
Field Name: Week
-
Field ID: calc_e8lzmj3dhd
-
Formula:
IF(true, Query, null)
Week
-
What does it do? We use this to show you weeks starting on Mondays.
-
Field Name: Week
-
Field ID: calc_ta0lq6h6gd
-
Formula:
DATETIME_TRUNC(Date, ISOWEEK)
Metric Selection 1
-
What does it do? We use this to let you switch between metrics.
-
Field Name: Metric Selection 1
-
Field ID: calc_u175ntwpgd
-
Formula:
CASE
WHEN Metric Selection 1 Parameter = 'Clicks' THEN Url Clicks
WHEN Metric Selection 1 Parameter = 'Impressions' THEN Impressions
WHEN Metric Selection 1 Parameter = 'CTR' THEN URL CTR
WHEN Metric Selection 1 Parameter = 'Avg. Rank' THEN Average Position
END
Metric Selection 2
-
What does it do? We use this to let you switch between metrics.
-
Field Name: Metric Selection 2
-
Field ID: calc_1fi6hlzpgd
-
Formula:
CASE
WHEN Metric Selection 2 Parameter = 'Clicks' THEN Url Clicks
WHEN Metric Selection 2 Parameter = 'Impressions' THEN Impressions
WHEN Metric Selection 2 Parameter = 'CTR' THEN URL CTR
WHEN Metric Selection 2 Parameter = 'Avg. Rank' THEN Average Position
END
Metric Selection 3
-
What does it do? We use this to let you switch between metrics.
-
Field Name: Metric Selection 3
-
Field ID: calc_uznjcmzpgd
-
Formula:
CASE
WHEN Metric Selection 3 Parameter = 'Clicks' THEN Url Clicks
WHEN Metric Selection 3 Parameter  = 'Impressions' THEN Impressions
WHEN Metric Selection 3 Parameter  = 'CTR' THEN URL CTR
WHEN Metric Selection 3 Parameter  = 'Avg. Rank' THEN Average Position
END
4. Do you care about targets?
If you don’t care about targets:
You can just copy with the existing sheet and delete the targets page which won’t work properly.
If you do care about targets:
Time to make a copy of the targets Google Sheet.
You’re obviously going to want to alter the targets to match something sensible for your own website.
5. Finally time to make a copy of the report
Hoorah we’re here!
Time to actually make a copy of the report.
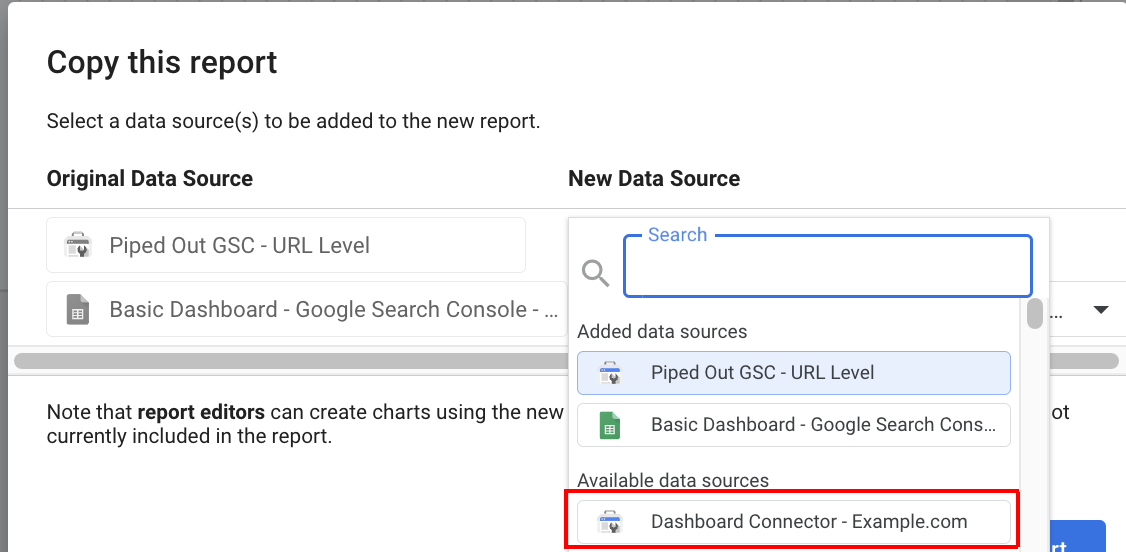
If you’ve done everything correctly you’ll be able to see your data source you’ve created and named somewhere in this dropdown.
If you don’t see it, then you’re going to need to go back and check you’ve made all the parameters and fields which need to be added.
6. Are you seeing any things fail?
If you’re seeing graphs which haven’t copied over properly, that’s because you didn’t set the ID on the field, so you’ll need to go back and check the IDs of your fields in this blog post against the ones you created.
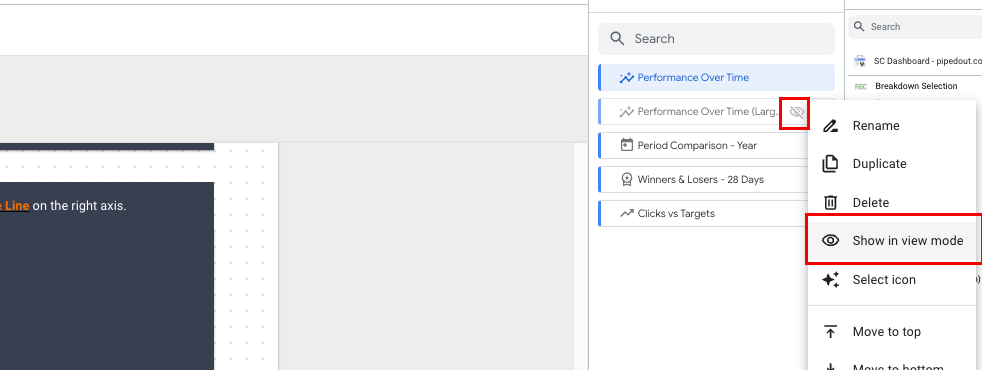
7. Is your site very large?
Get in touch with us, we can make you an even better report! But also if your site is very large these graphs on page 1 will probably never load.
![]()
In that case you'll want to:
[Edit] > [Page] > [Manage Pages]
In the menu on the right hand side, unhide the large site version of the performance over time page and use that instead (you can just delete the other page).
It performs a bit better with larger sites, where LS can't handle the blend.
7. Off to the races
Hoorah! Hopefully now you’re up and running with the dashboard and start going. We've got a full tutorial on the dashboard at the end of the set-up video above.
8. Limitations
This dashboard isn't perfect. The default connector lacks a lot of functionality, which we expand on with data warehouse and pipelining.
You can see our equivalent data warehouse version of this report here.
Features
- Revenue/conversions
- More than 16 months data
- More advanced segments like "pages which drive 50/80/90% of revenue/traffic"
- Faster dashboard
- 3 - 4 times more SC data.
- Better period comparison control
- Better metrics for examining the data.
If you'd like better reporting for your team, please get in touch!