4 Steps for SEO reporting for C-Suite & Leadership
Leadership & C-Suites care a lot about reporting.
When you’re at the top, you have to read a lot of reports and make decisions.
But please don’t send them the reports/dashboards you use every week. They’re not specialists, they don’t want all the tiny details.
So how do you make reports which leadership will appreciate?
4 steps:
- Format
- Dates
- Simplicity
- Money & Funnels
- Test
0. Looking for an example?
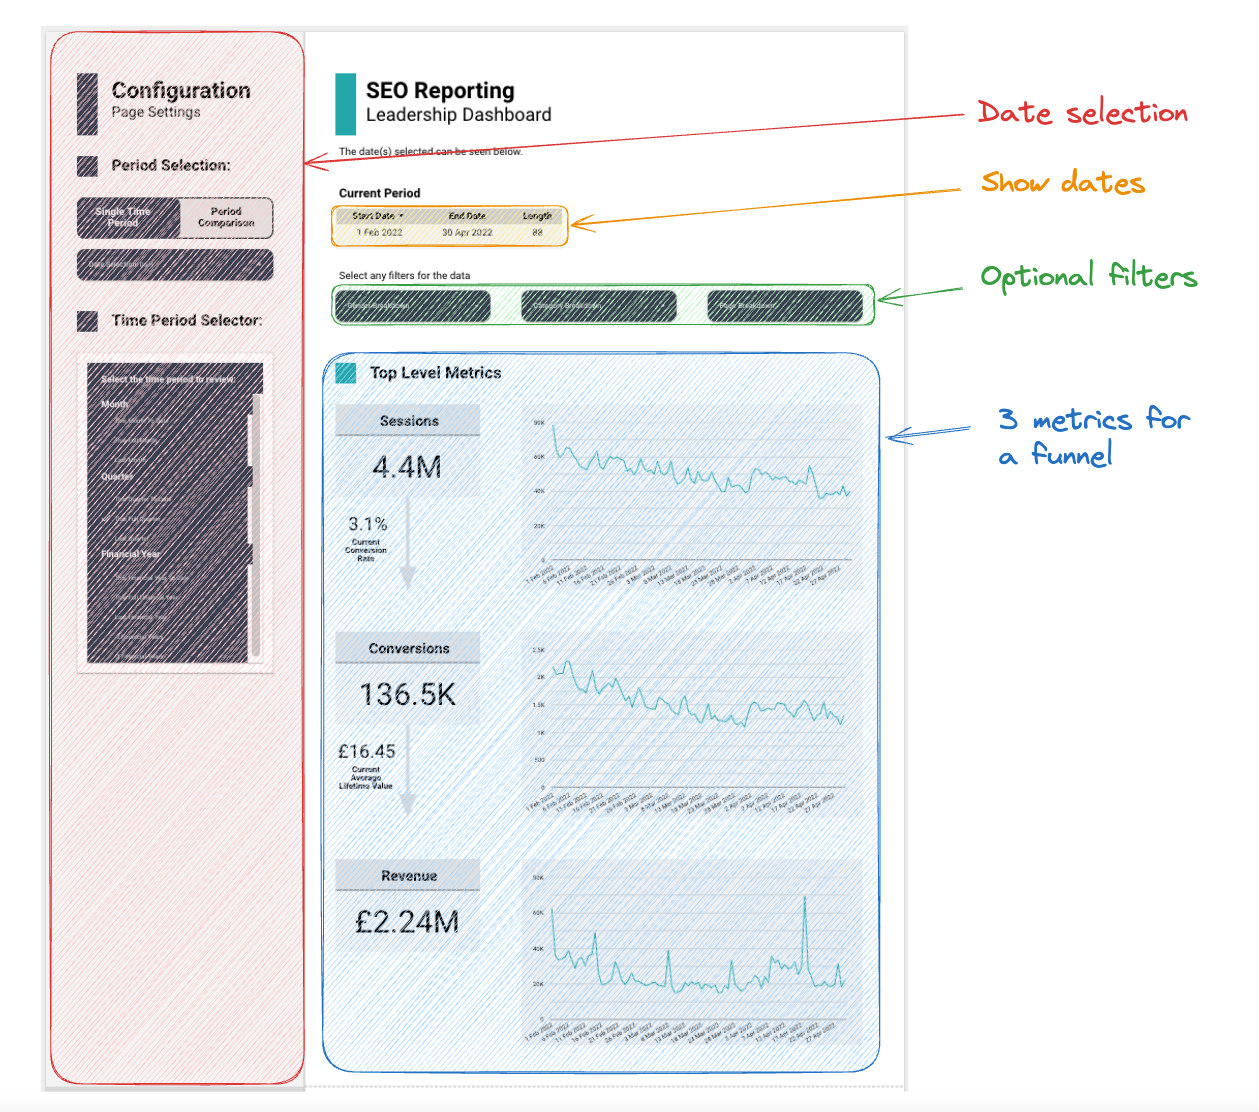
Here’s an example of a leadership dashboard for SEO, we’ve built on top of BigQuery in Looker Studio:
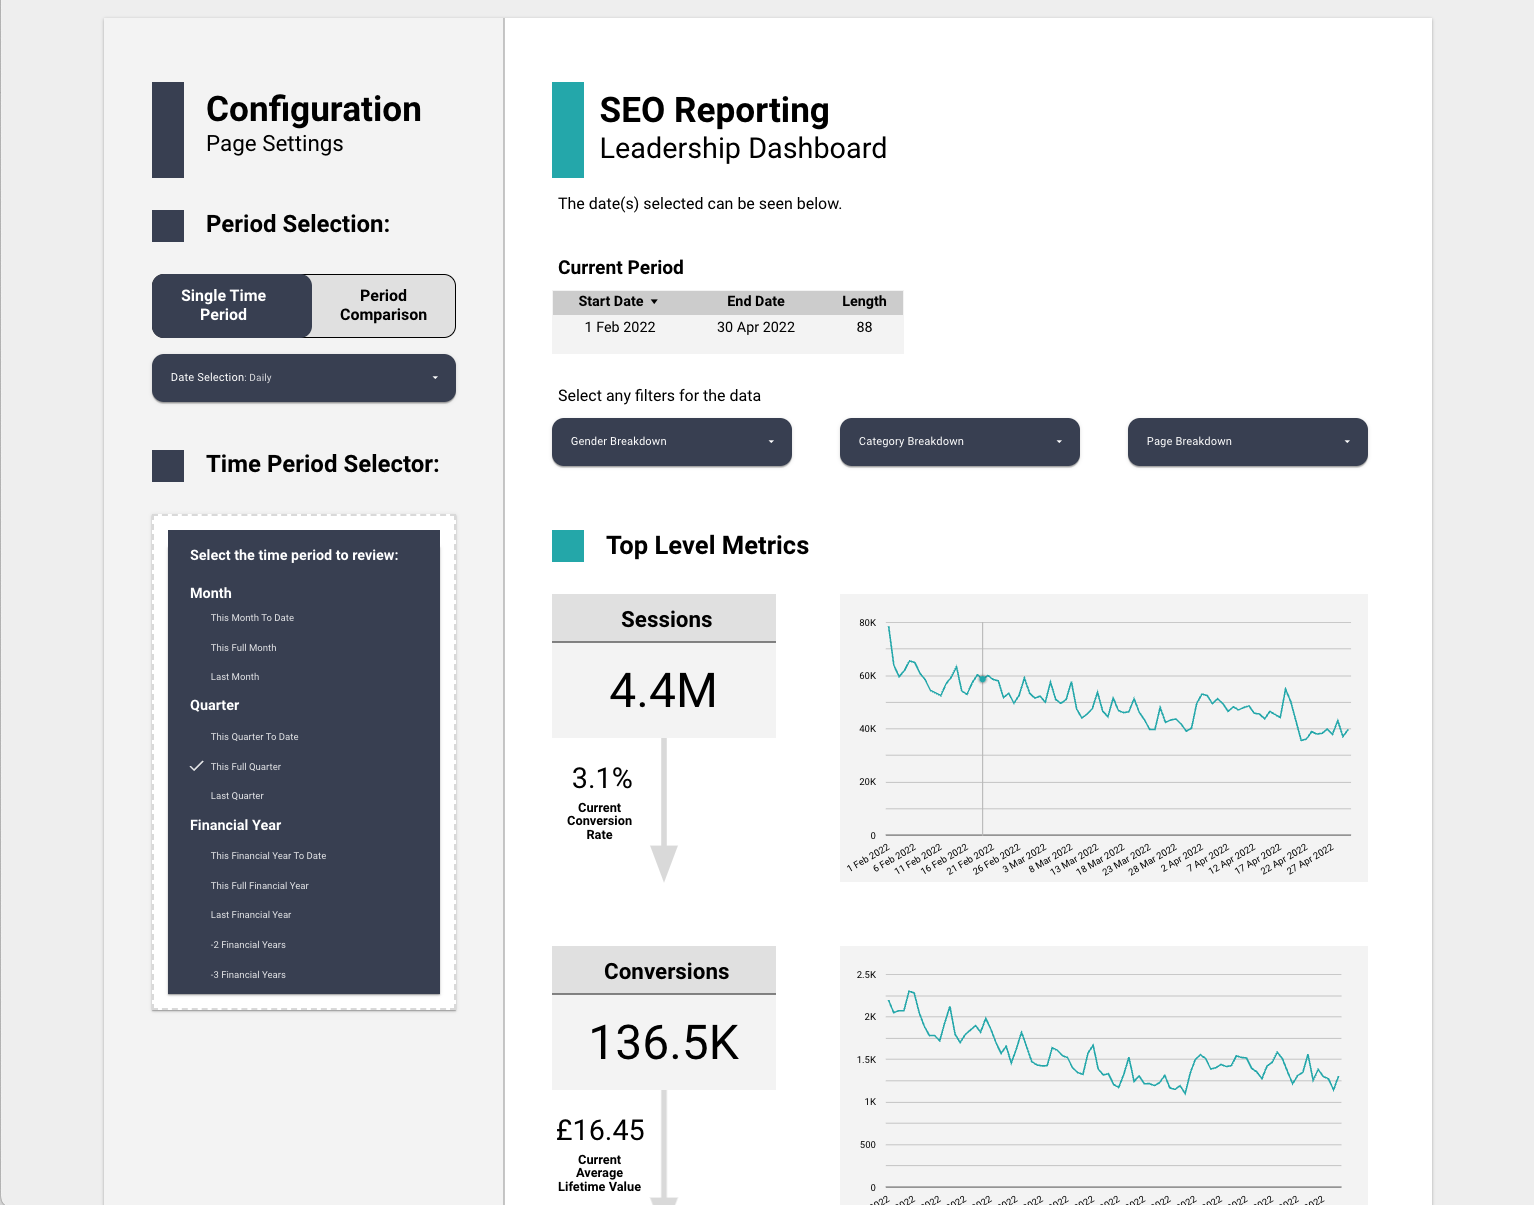
This is for a hypothetical lead based business (you’ll note there is no AOV etc.) or the more common metrics we might expect for an e-commerce business.
We’ll come back and update this post in the future with more example template for inspiration as we roll them out.
1. Report or dashboard?
When you’re presenting to a board or leadership you probably want to have a presentation.
Why?
You don’t just want numbers, you want the story. The numbers set the narrative, but you still have to tell the story.
But you probably also want a dashboard because:
- You want to automate the pulling of the numbers that you’ll base your report on.
- Leadership teams and C-Suites will sometimes go and check numbers themselves in between presentations and dig into the details.
We’re going to show examples with dashboards, but the themes apply to both.
Here’s an example of dashboard containing the numbers we used in the presentation.
2. Don’t use 28 days, use quarters
If I’m trying to figure out where traffic dropped, I might look at a 28 day window.
A multiple of 7 because I get even numbers of weekends and weekdays, so removing any seasonality and 4 weeks because it’s long enough to see short term trends.
Leadership and C-Suite’s tend to think in terms of the business calendar i.e. the financial year.
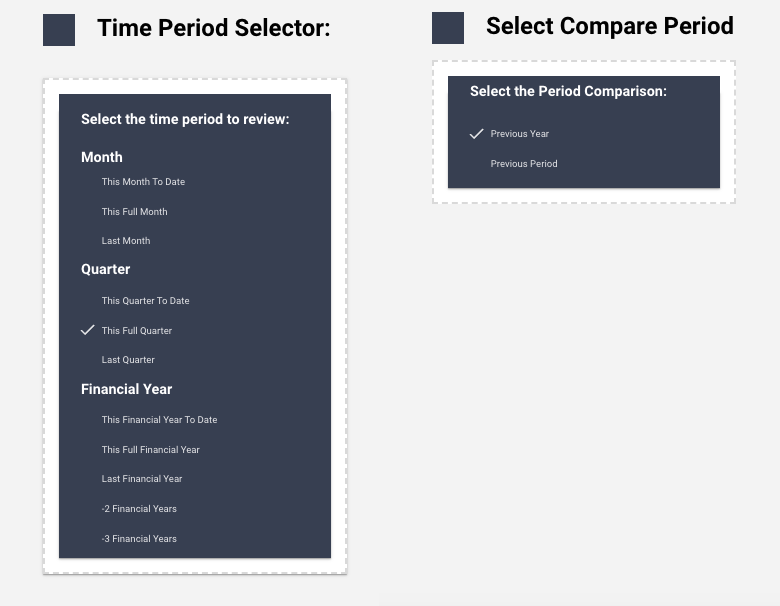
Rather than defaulting to the latest 28 days or custom date selectors we want to be offering date options like:
- This Financial Year (to date)
- Last Financial Year
- This Quarter (to date)
- Last Quarter
- This Month (to date)
- Last Month
What is: to date
This is when you take the time period and show it up until the current day. So for example quarter to day (QTD) would give you every day up until today in the current quarter.
It’s useful for period on period reporting.
3a. Don’t let someone pick the wrong option
We all love a date selector. But it’s a fiddly trap.
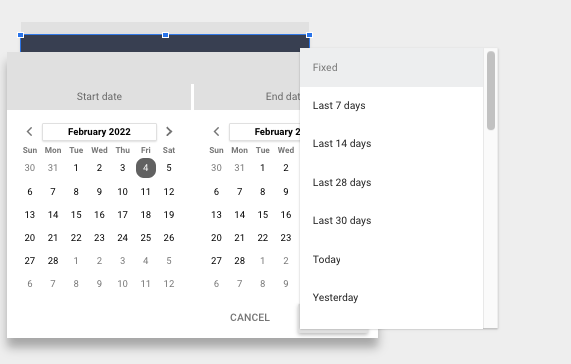
But when you’re presenting to a board, you really don’t want to have picked the wrong date.
You also don’t want your CMO to accidentally select the wrong date period when he’s looking up numbers.
For leadership and C-Suite dashboards we’d recommend removing your custom date periods and providing just the automatic date options.
In our experience the headaches from people getting dates wrong isn’t worth the benefit of being able to pick custom date periods.
3b. Don’t show too much at once
We’ll touch on this again in both of the next sections, but don’t show too much on these dashboards and reports.
Distill, distill and distill again.
It’s really easy to overdo it and quite hard to do under-do it.
Let’s breakdown our example dashboard, there are only 4 things going on:
And compare that to the first double page of our search console report.
There are 12 separate filters for different options, notably more metrics and segments to dig into.
- Great if what you want is to analyse your site.
- Bad if you’re a busy executive trying to figure out WTF is going on.
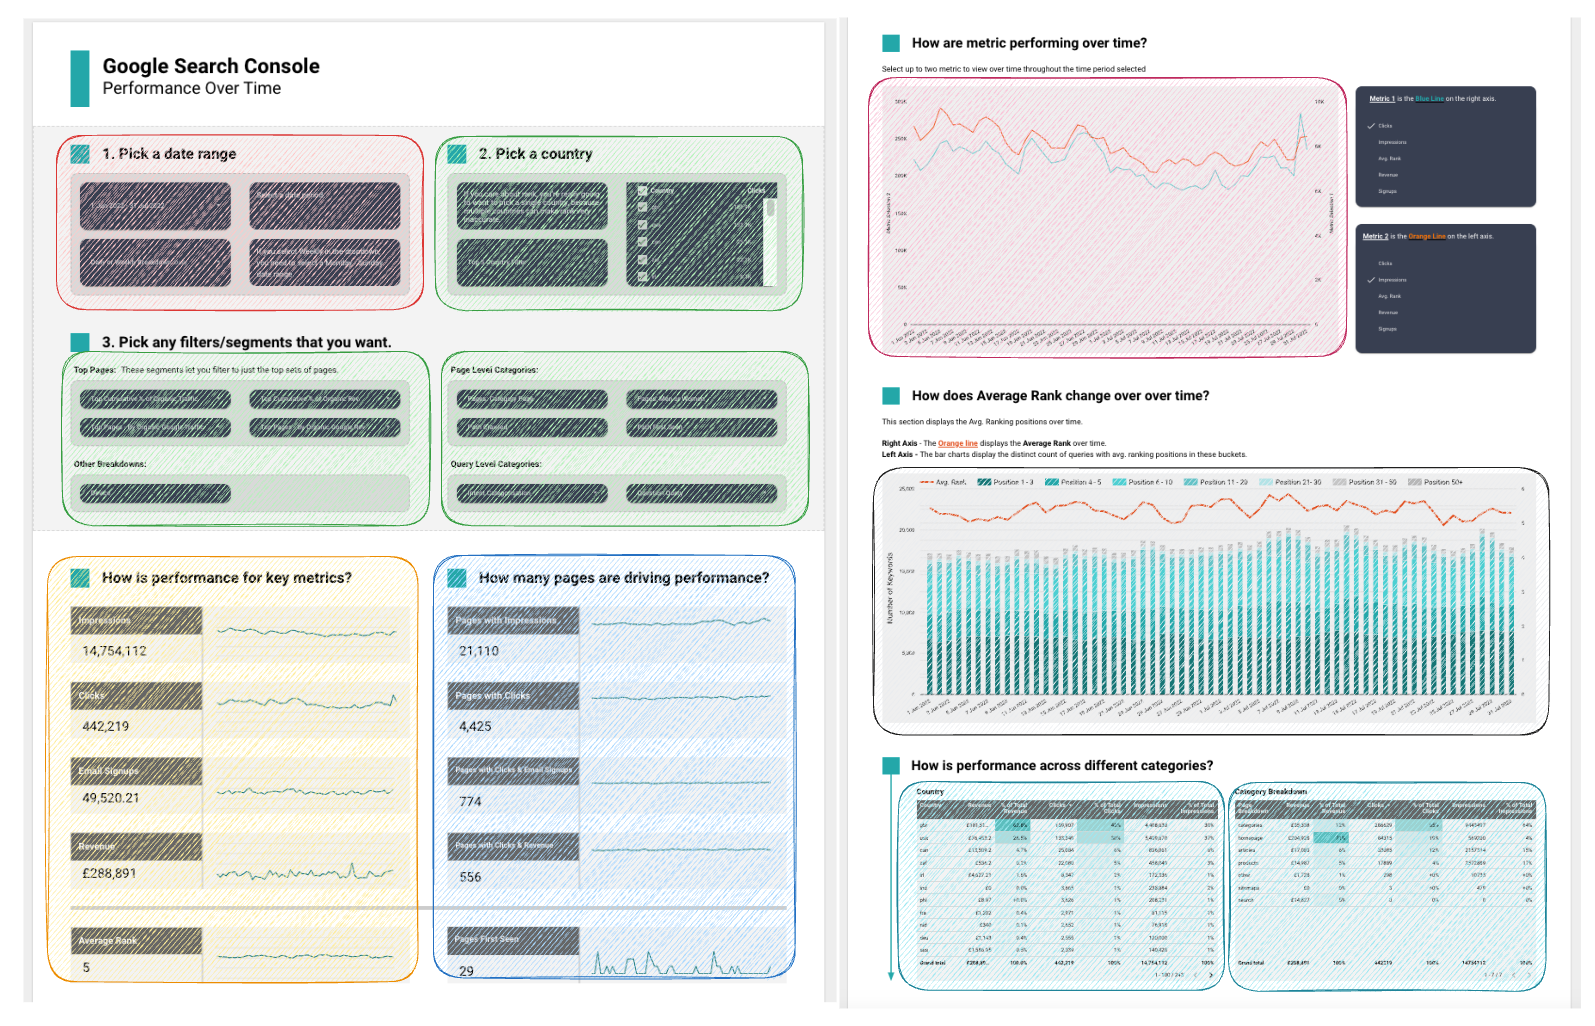
Add too much and you increase the chance of sending the meeting off on tangents and moving away from the core story.
You’ll have meetings where the C-Suite get totally side tracked by a metric you didn’t want them to focus on.
What if I have too little?
If turns out people do want additional context you can always add more.
We’ll typically put a small amount of exploration capability at the bottom of our leadership dashboards.
It means someone can quickly dig into extra segments without dominating the initial picture or giving too much exploration.
4. Money & Funnels
Business care about money. Your CEO cares about money.
Rank, traffic value, impressions, clicks, share of voice - these are all great but they’re not money.
So start with money i.e.
- Revenue
- Profit
- Leads * LTV
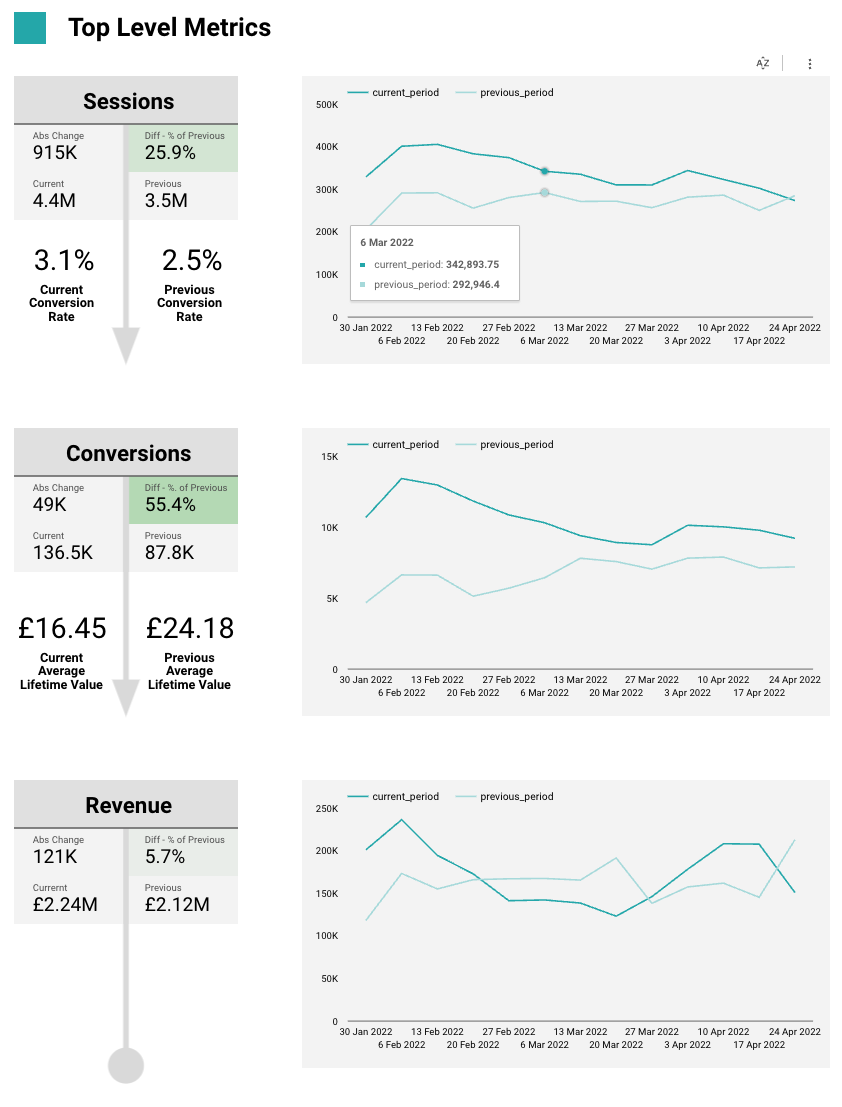
But you also want some numbers to provide context to the money.
You want a funnel which incapsulates your channel. So we might end up with:
- Sessions
- Engaged Sessions
- Conversions
- Revenue
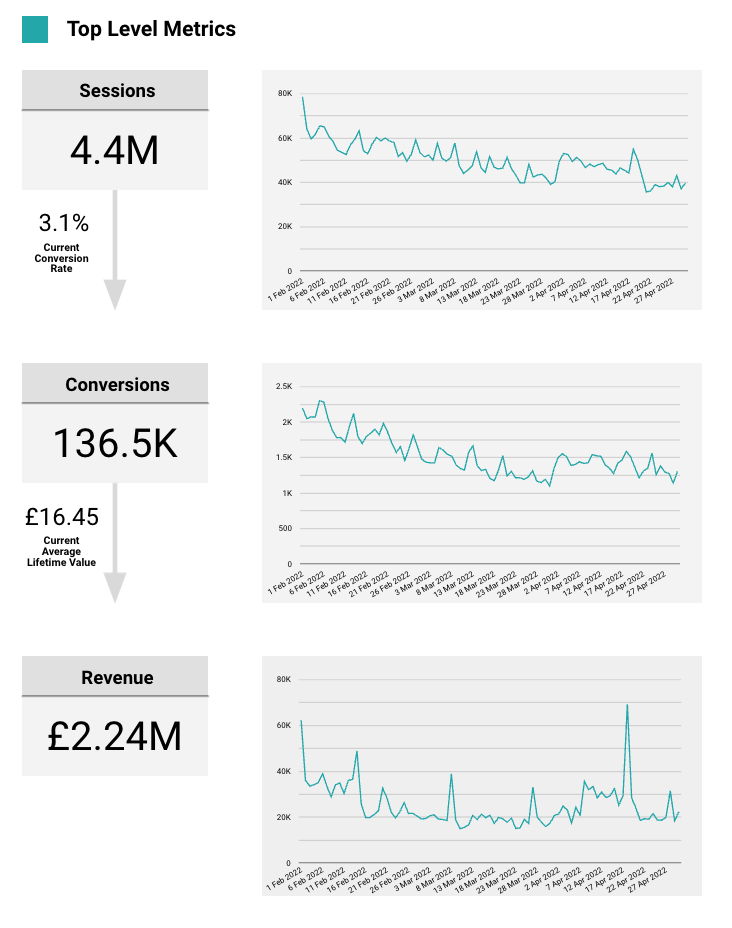
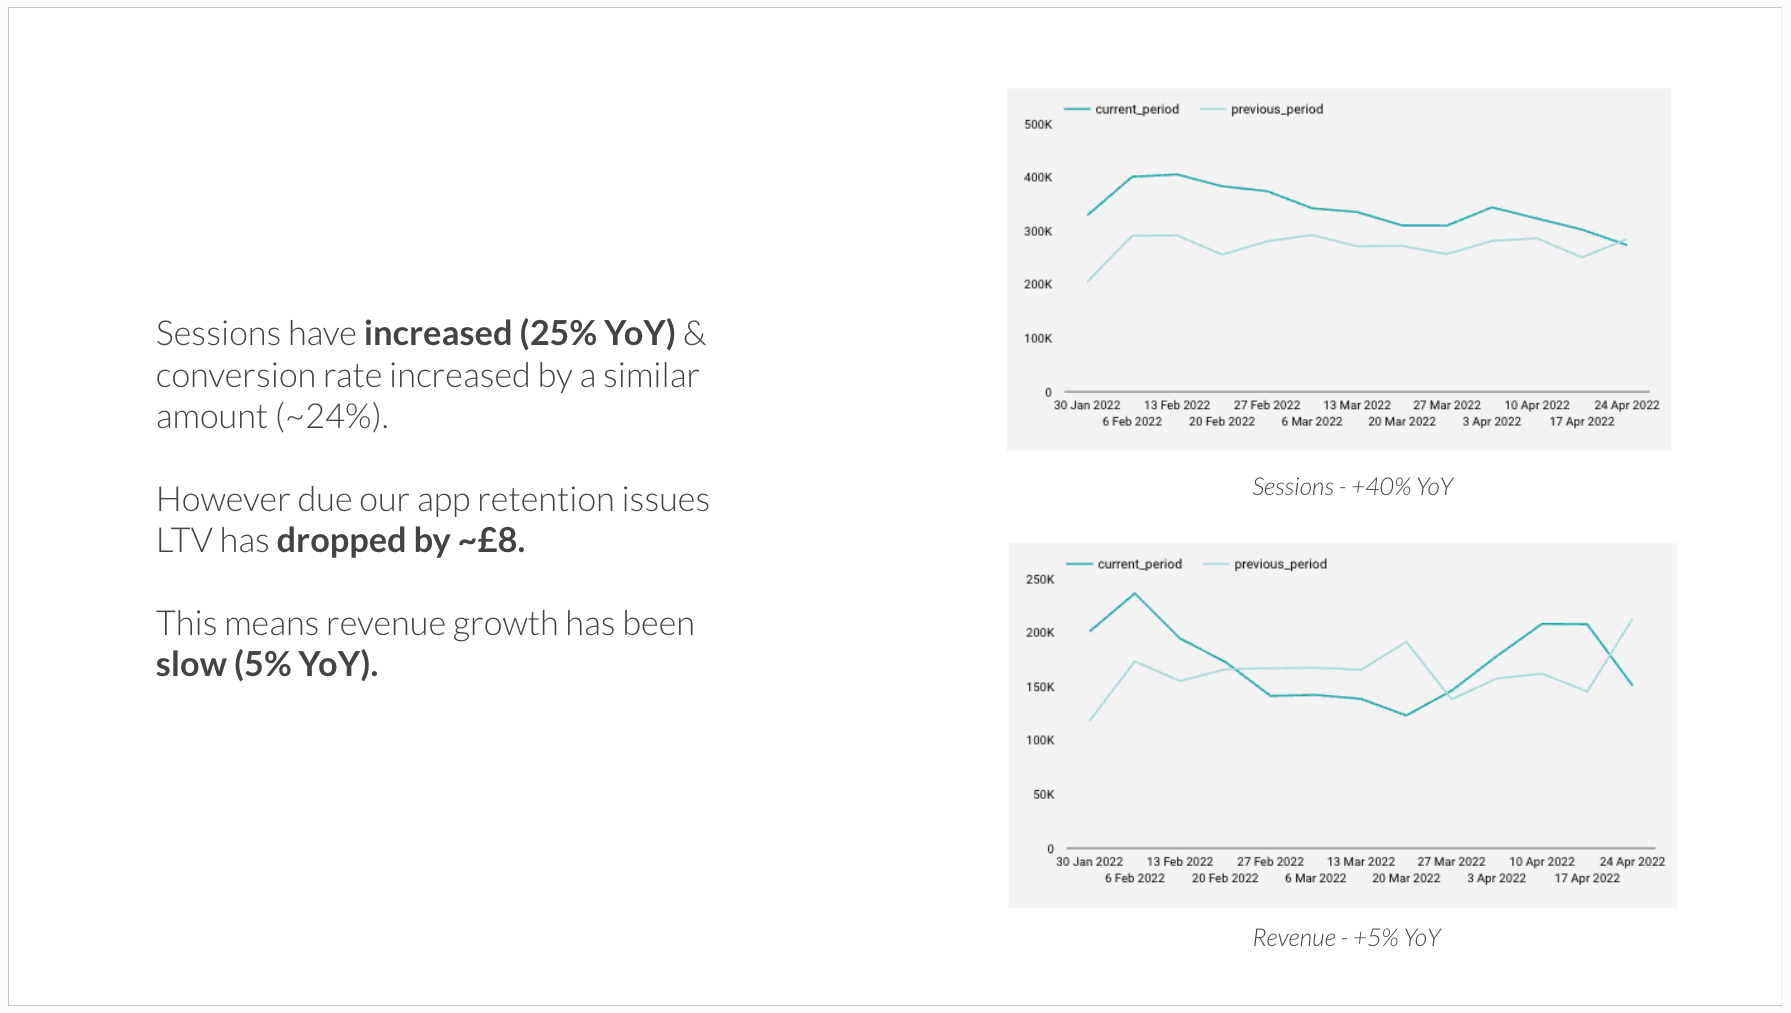
This means that when revenue is up or down, we can understand it by looking at the different steps in our funnel.
Maybe LTV is down which has causes revenue to drop, or engaged sessions has gone up along with our revenue.
If you’re feeling particularly ambitious you can look to build a more complex SEO funnel:
- Pages crawled
- Pages indexed
- Sessions
- Engaged Sessions
- Conversions
- Revenue
The pros of something like this are:
- Many of actions you want to take as an SEO might impact crawling & indexing and if you’re not showing those numbers to the leadership team then it will be harder to justify those changes.
The cons are:
- It’s a lot more work.
- You probably want to personalise those metrics.
We’re walking into the direction of input metrics here, which we talk about a little more in our SEO reporting guide.
Conclusions
Ok so let’s summarise that. What do we do now?
Go and change our reports:
- Keep it simple: Fewer metrics, less customisable options, clean layout. Show only what you need.
- Show the core metric your business cares about: I.e. 80% of the time this is money. The other 20% it’s growth.
- Show the funnel to that metric: That will help you set the context for what you’re doing.
- Date periods should be business focused: Quarters, financial years, months.